Our valued sponsor

Total return by asset for last 200 years

Register now
You must login or register to view hidden content on this page.
Please explain me this
Imagine I invested 1 million in s&p500, i collect 1.35% dividends and right after the price falls by 50%, so I'm worth 500k. How much dividends I get in $ ?

It depends on lots of factors. Usually the decrease in dividend percentage is delayed after a crash, by a few months. So, at first you'd probably get ~3% of $500k in dividends, and then you'd get 1.35% of $500k, once companies in the SP500 get affected by the crisis in question and reduce/eliminate dividends.

At least that's what happened during the last two crashes (2009 and 2020).

It's hard to predict the future in this sense though, because we don't know what will cause the next crash or how bad it will be.

As they say, "hope for the best, but prepare for the worst."
 
  • Like
Reactions: Radko and uranium
I started trading in 1999, right before the Tech bubble. Before that I was a long-term invertor.
You must have made a huge loss in the beginning of the 00 ?
 
  • Like
Reactions: jafo and uranium
You must have made a huge loss in the beginning of the 00 ?

Back in 2000 I was shorting a lot of Tech stocks, it was too obvious that it was a bubble, there were so many Tech companies with absurd valuations, it was crazy.

It's "easy" to make money on a bull market and on a bear market, the challenge comes when the market is trading sideways.

I no longer trade stocks, only Futures. As always, risk management is everything in trading.
 
Last edited:
  • Like
Reactions: jafo
Just take a position in specific asset classes... still some good positions pre-May next year when it should be peaking for the later / lagging equities. 1.webp2.webp

Mind, it's really jumped ahead of the liquidity cycle this season so might end up blowing through to late 2025.
 
It’s not a price forecaster - that’s another one - think it had around 320k-340k based on liquidity generated by mornterizing the debt being rolled over currently, another one had around 120k to 170k but lower end monetizing

One area I have concern over - most of my trusted processes lead me to think early 2025 is the cycle end but I also am aware as we speak monetarization is occurring increasingly more towards Q4 and that takes up to a year to flood into the markets
 
  • Like
Reactions: uranium
It’s not a price forecaster - that’s another one - think it had around 320k-340k based on liquidity generated by mornterizing the debt being rolled over currently, another one had around 120k to 170k but lower end monetizing

One area I have concern over - most of my trusted processes lead me to think early 2025 is the cycle end but I also am aware as we speak monetarization is occurring increasingly more towards Q4 and that takes up to a year to flood into the markets
Agreed 100%
Q4 2025
150k on average
Thanks for your input
 
  • Like
Reactions: wellington
“Goes back in broom closet”.


No offence, but perhaps if you took the time to understand this you'd be making 1000+% YoY instead of 10-40%

It’s not a price forecaster - that’s another one - think it had around 320k-340k based on liquidity generated by mornterizing the debt being rolled over currently, another one had around 120k to 170k but lower end monetizing

One area I have concern over - most of my trusted processes lead me to think early 2025 is the cycle end but I also am aware as we speak monetarization is occurring increasingly more towards Q4 and that takes up to a year to flood into the markets
NASDAQ has been down 6.59% since the past month.
Any comments on forecasts? @wellington

Perhaps it's the start of the cycle end?
 
NASDAQ has been down 6.59% since the past month.
Any comments on forecasts? @wellington

Perhaps it's the start of the cycle end?
Markets usually lead economy, economy is in the shitter...

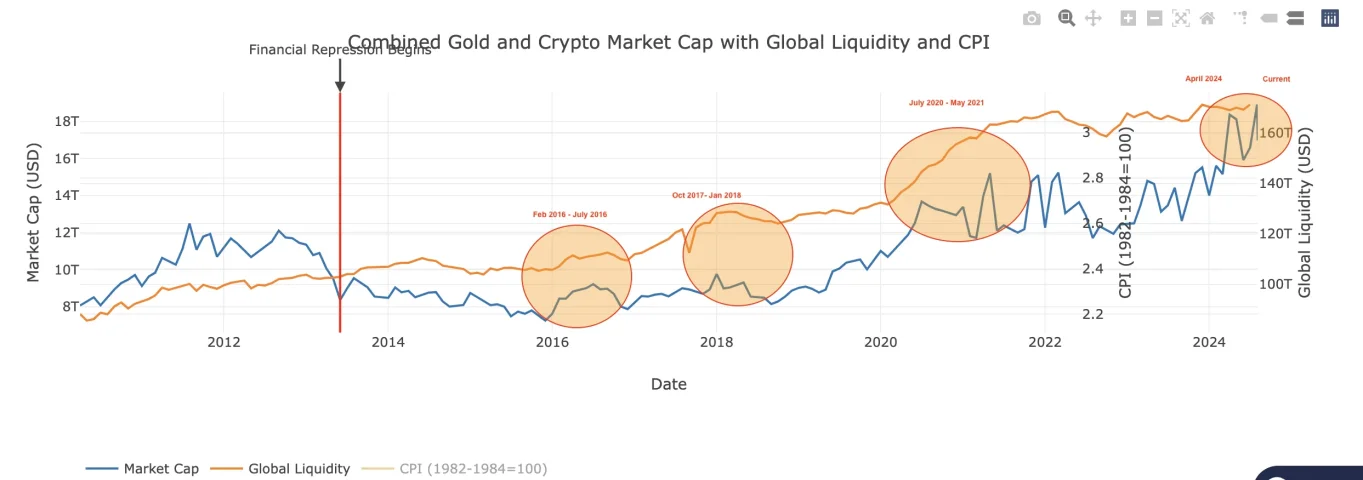
We hit the top of Liquidity (Gold-BTC v Liquidity around March period) but there's 10-16 trillion of refinancing this year) reminiscent of early-mid 2019 to me.

Prior BTC-XAU v GL
Peaked in April 24, then tried again (current failed)remove_image_metadata_1379dffc49932af8ad8101cb45c1ccdc_66b0a78884abd.webp
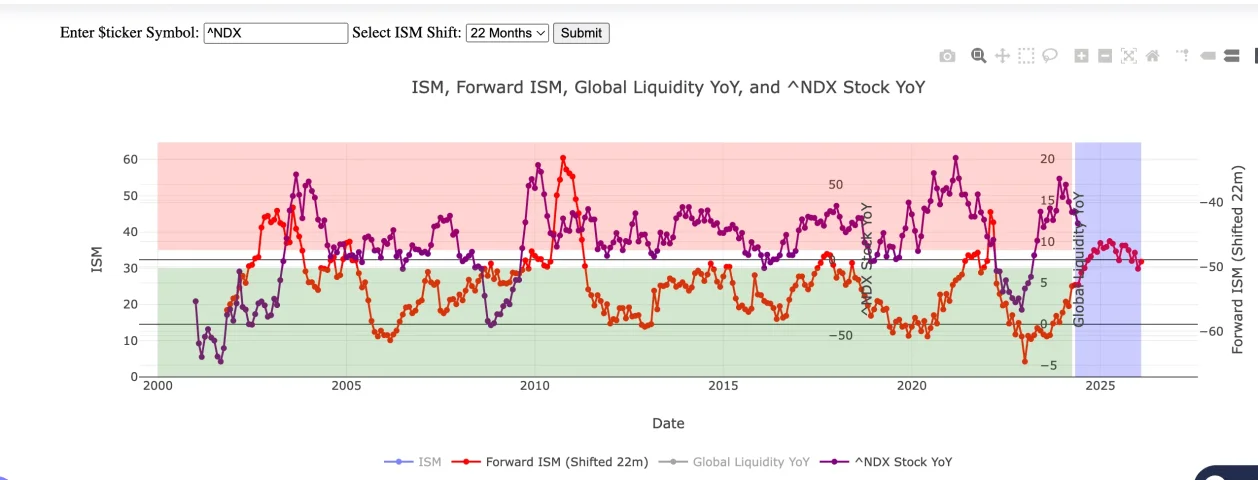
This one i find interesting as it's over time, and YoY value(s) which would lead me to believe either a break out, or a break down - either way a new longer-term trend is on the horizon.
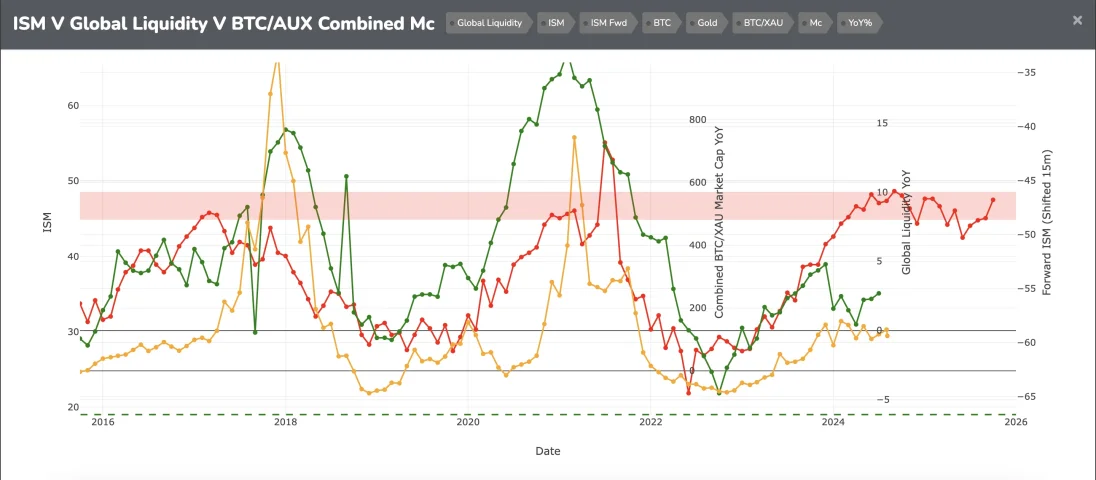
remove_image_metadata_4ce01aba5912f1db6e101db3f3eb9073_66b0a7d755636.webpremove_image_metadata_38cad1fc65d5eb1ac377e3093663d584_66b0a7d75028d.webp

Then if we look at the economic side, bottoming in various sectors (important) survey wise (US) bare in mind the economy lags markets, markets react to liquidity and risk change.
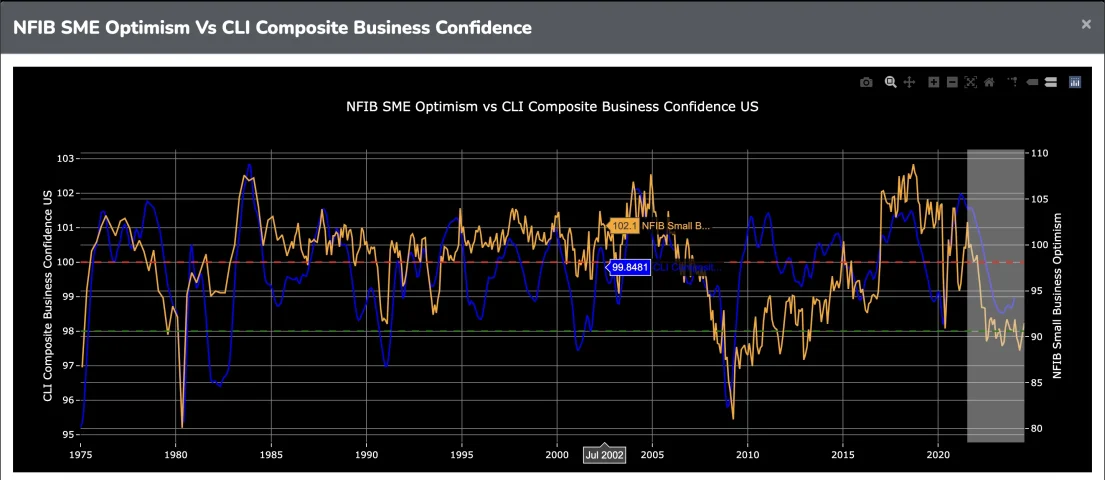
remove_image_metadata_37a8226d7f46570787f472ab030dc150_66b0a7d74a922.webp

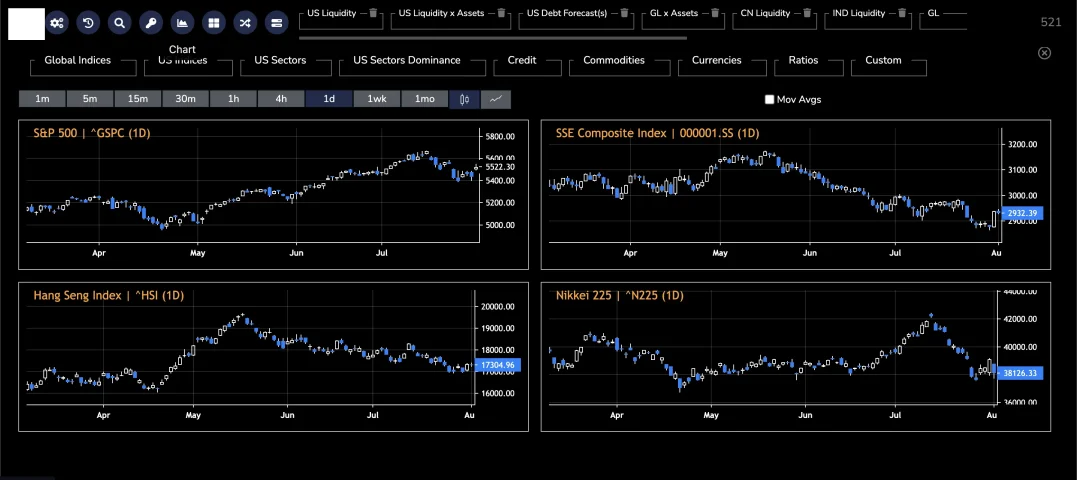
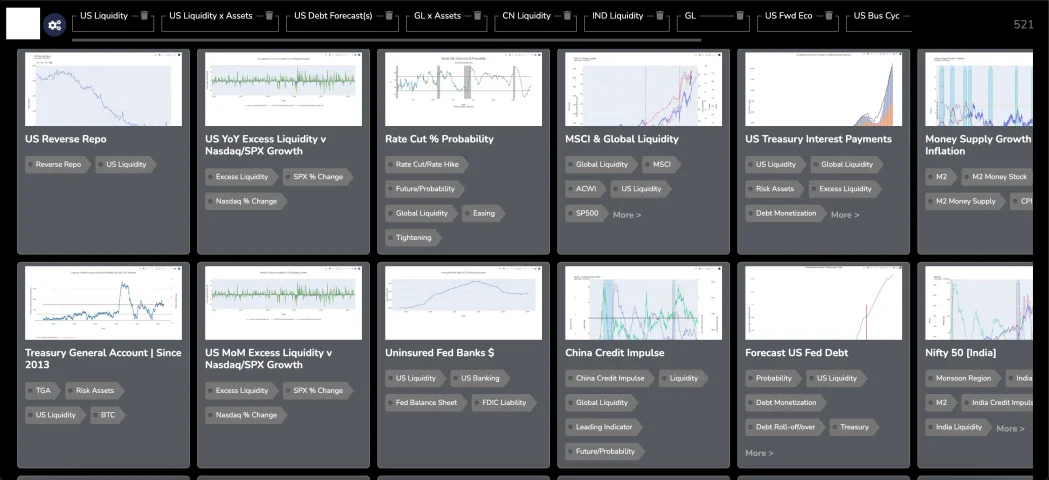
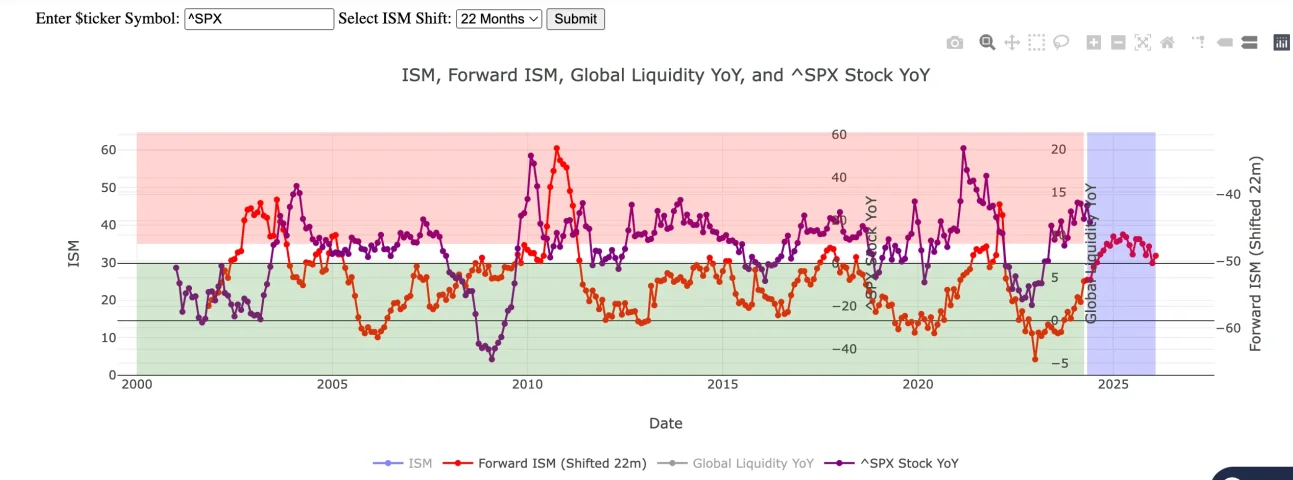
I do have some custom 5xx charts for tracking short/mid-term but i won't go re-posting all from that and counting in the 65m refi cycle a bit of nasty noise mid-term otherwise long-term carry on. (been building a terminal of sorts to make it easier to track)
remove_image_metadata_64c6c146c2993a4e109f3cfff7385219_66b0a7d75d46b.webp

remove_image_metadata_2e8a7a85e92b760e3dc7b790a7ce7c3c_66b0a7d759dd6.webp

FYI First chart normally marks the end of the cycle...

BUT this year is different -> 10-16 Trillion $ of State debt refinanced, then 75-130 Trillion $ of private sector/commerce debt.

But with the need to kill inflation, it might be a two pronged approach, refinance at current or near current rates and kill inflation over the next two years and then re-finance again in two years.

having said that shelter is usually the last shoe to drop in inflation

remove_image_metadata_39cba1f0281957de358797ca465dd393_66b0aa1ed14d7.webp

That being currently 2.2% roughly (inflation ex Shelter)

Shelter should be down in 3-6m dependent on the economy crashing or slowly grinding.

remove_image_metadata_4e634d2ee7593fed5ef48e744f230378_66b0aa8d98415.webp

@wellington you should start your own newsletter, one chart per week and soon you will show up on CNBC
The company generates far more than the talking heads showing up on CNBC
 
Last edited:
  • Like
Reactions: Don
The company generates far more than the talking heads showing up on CNBC
I am grateful and humbled by your valuable contributions to our forum, and I trust your insights have made a significant difference to many of us here.
@wellington you should start your own newsletter, one chart per week and soon you will show up on CNBC
I support this idea 100%. A separate thread for this topic would help keep the discussion organized and allow us to delve deeper into the specifics without cluttering the current thread.
 
I support this idea 100%
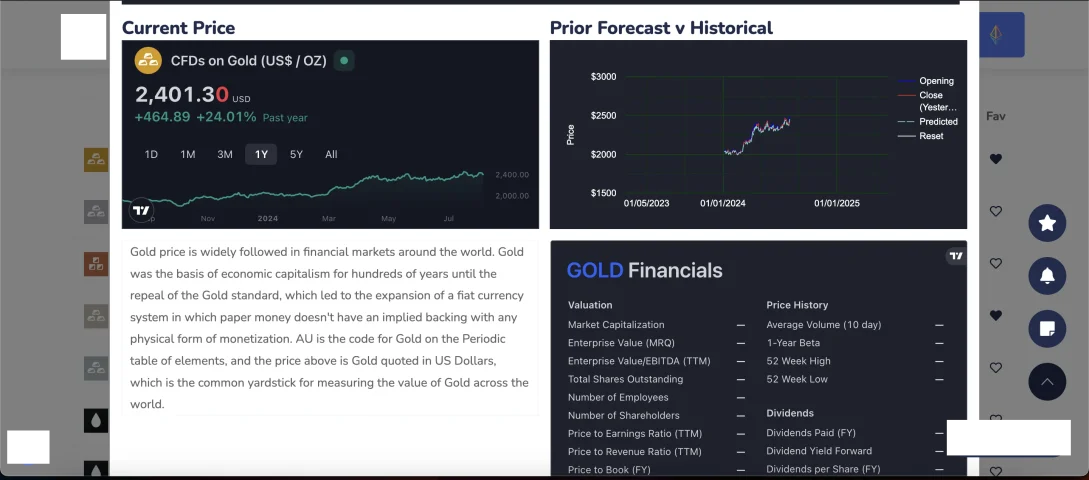
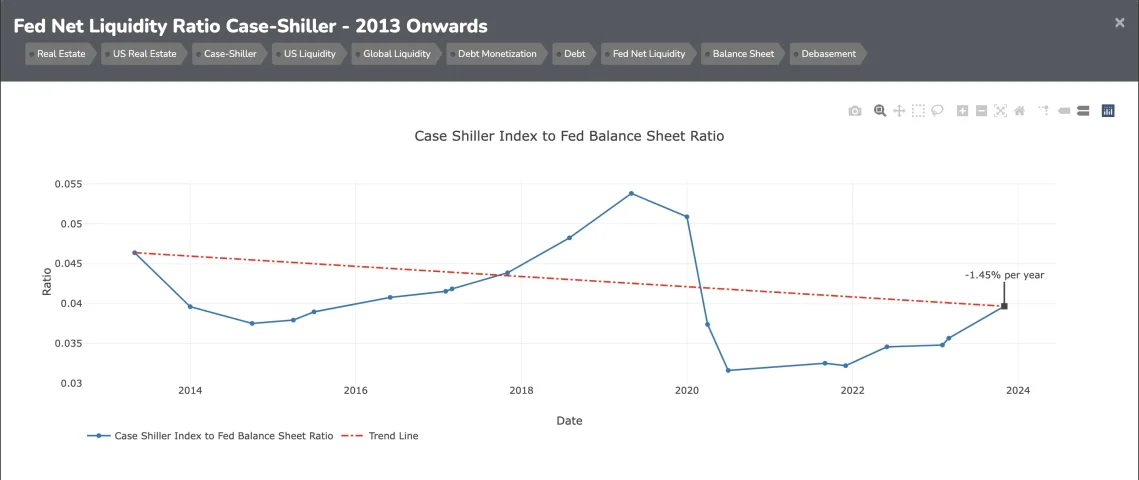
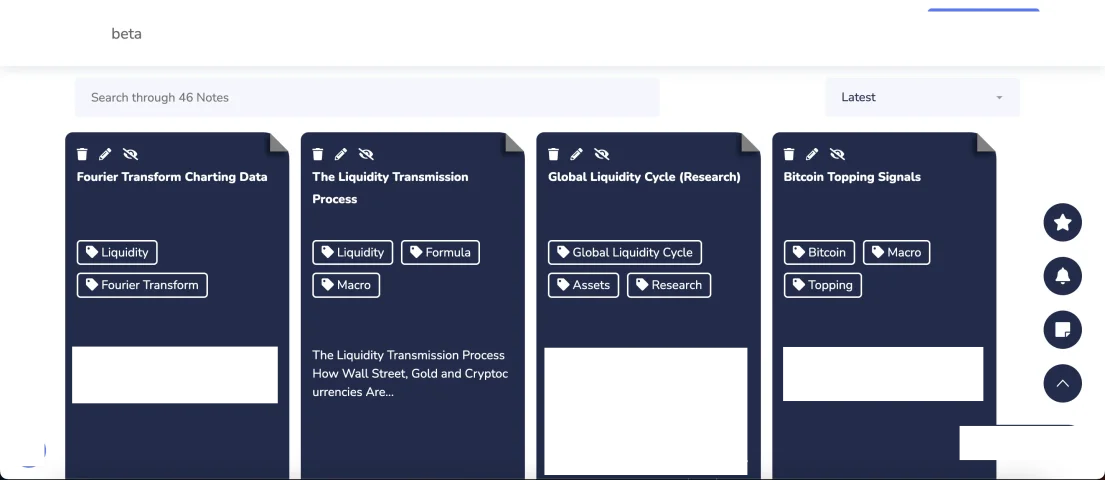
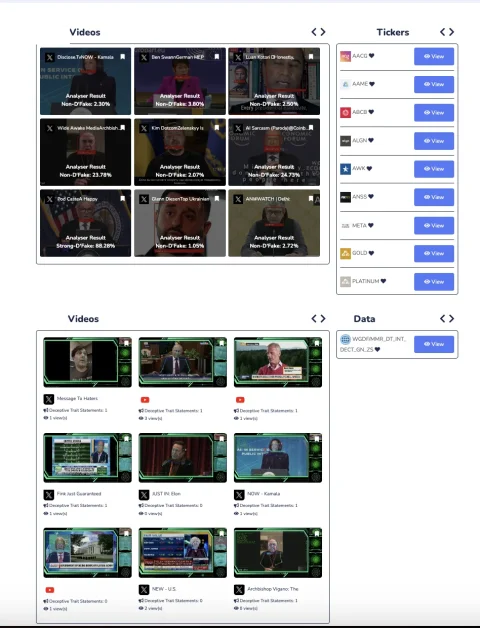
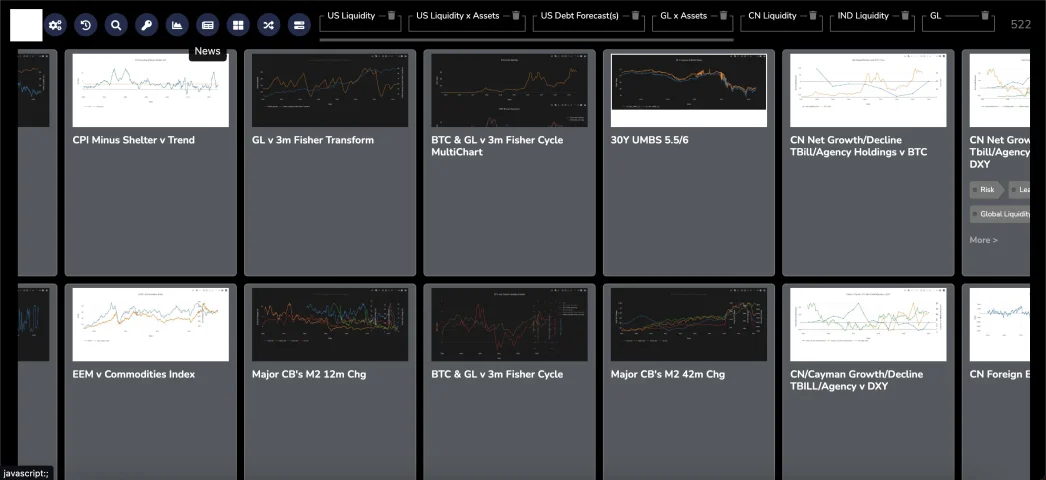
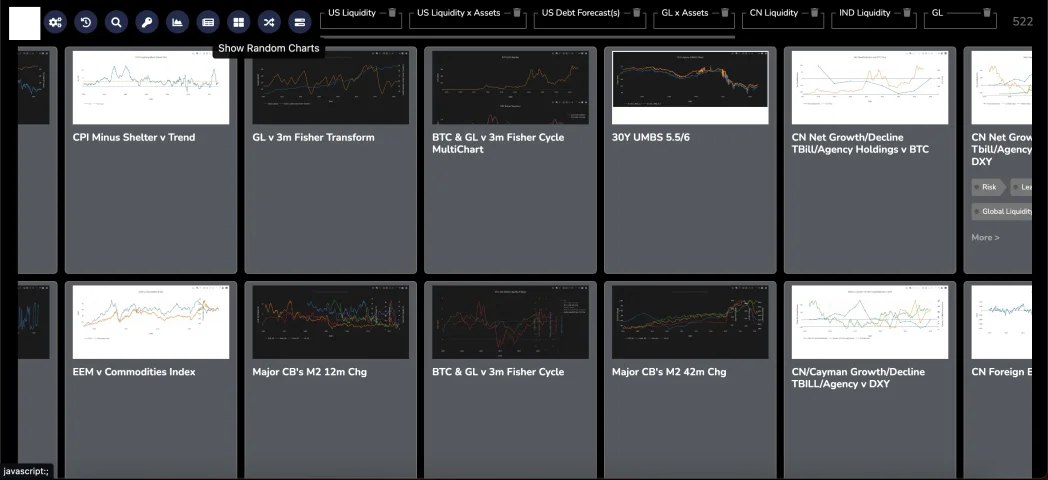
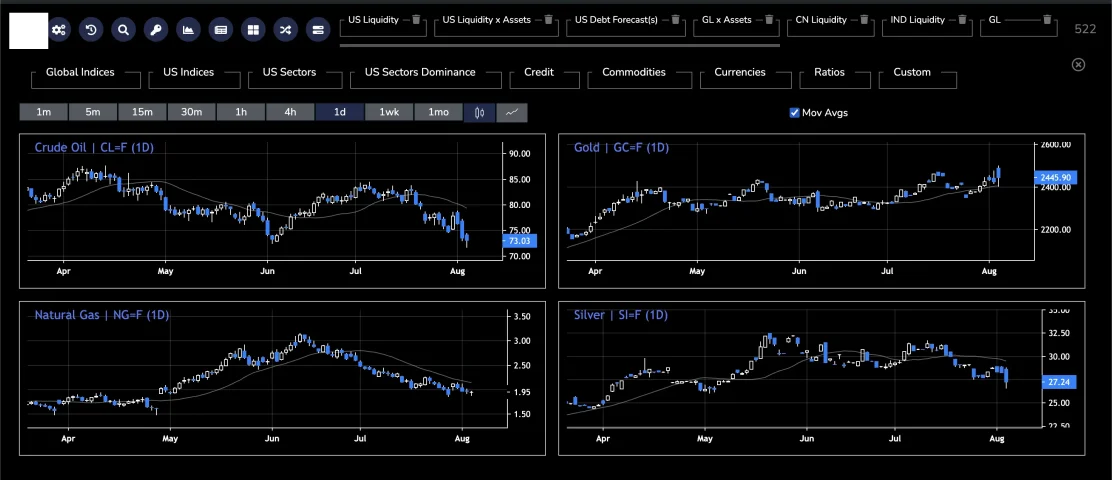
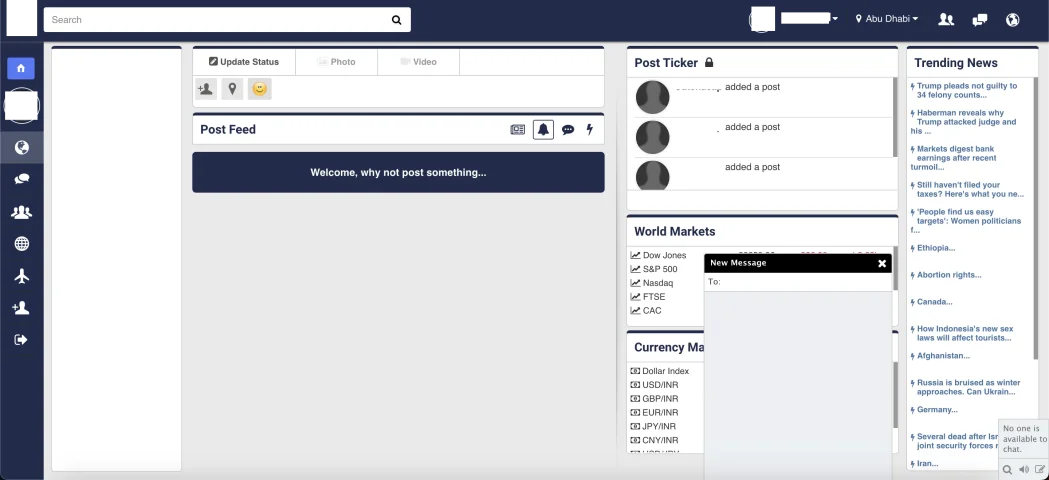
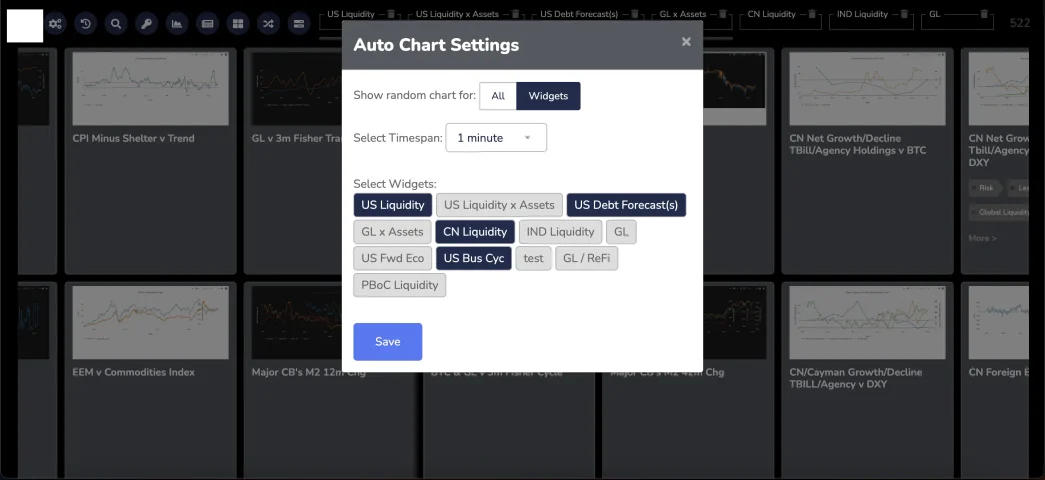
Been putting together a front end of sorts for public to use.

Usually we use internally but some of the data etc and tools have been re-worked for external deployment over the past year or so.
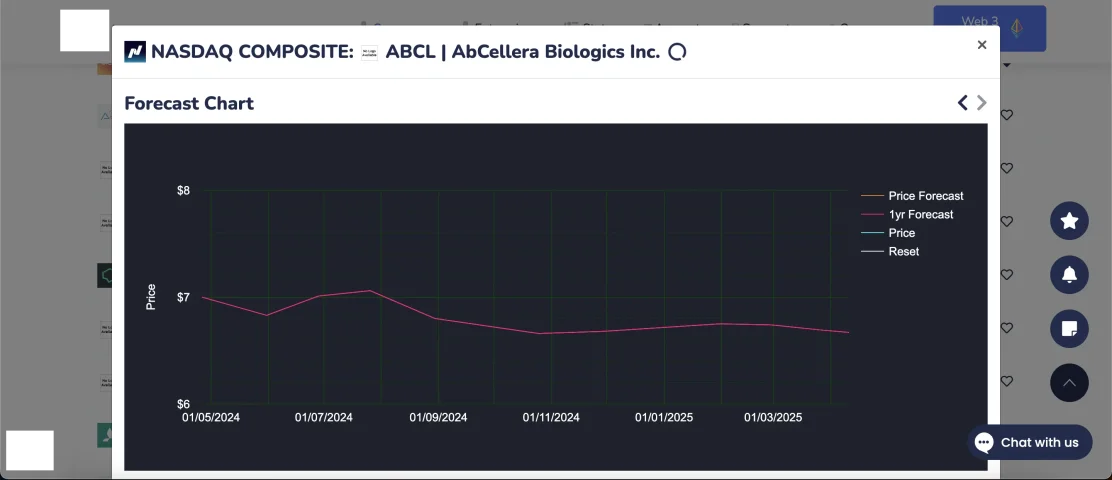
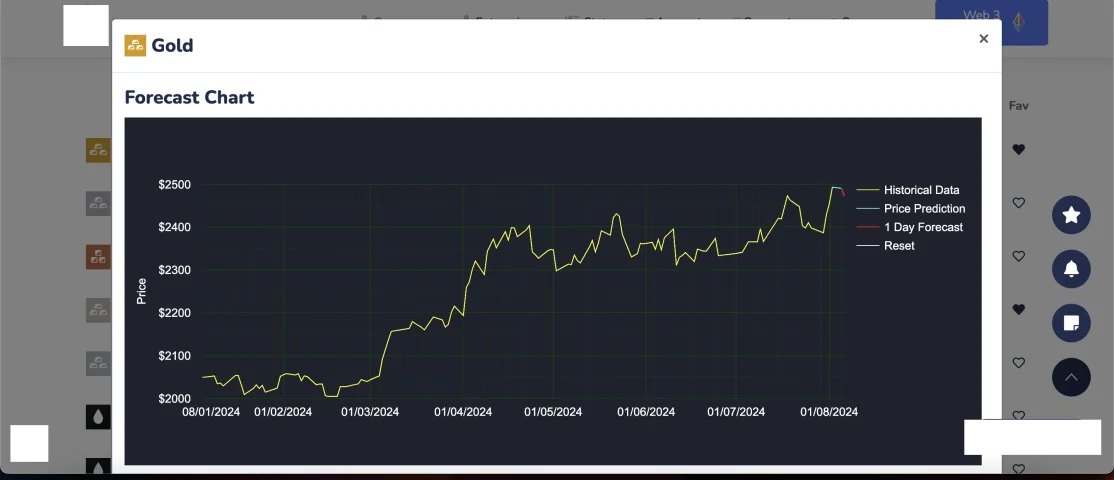
Not launched yet, but gives you an idea - some of our internal tools external -(still coupling systems together), much more useful than a Newsletter.


No particular order.remove_image_metadata_0d14ba6050268fe03f3292c25f725c99_66b10fa70c1eb.pngremove_image_metadata_0d15e801841789d84f7925e67a7f18f0_66b10fa70955d.pngremove_image_metadata_6d950c18a2922f9955047680605577a6_66b10fa7107fb.pngremove_image_metadata_54f836db6c1be1f352e012a7de8e1d25_66b10fa70e4db.pngremove_image_metadata_61f6ed456cfdf62ee8d3fed0baa725fc_66b10fa70152b.pngremove_image_metadata_404bc55347569dfcbd94452760be9fc1_66b10fa6e6ccc.pngremove_image_metadata_481e7534da19b1c8c0b3e1ddf7a073d0_66b10fa71b727.pngremove_image_metadata_3191c00ec7f5fb1bd9aed2dcfa250b30_66b10fa715c0a.pngremove_image_metadata_9231192556f80468a41af02c8685de39_66b10fa6ee1e4.pngremove_image_metadata_ab0d5c37121c04ec44cb56694982895a_66b10fa71eddc.pngremove_image_metadata_b796f4e83584907530130c2219272173_66b10fa6eb1fe.pngremove_image_metadata_bfd9ca8177fb4ceb6bf47eb94d51ead3_66b10fa712c62.pngremove_image_metadata_df52e678332ecc92b86b50c7eb582bb0_66b10fa706dcf.png
 
  • Like
Reactions: clemens and Don
are these tools something you developed internally in your company @wellington ?
 
Register now
You must login or register to view hidden content on this page.